메인 컨텐츠로 가기

Excel에서 최고 또는 최저 값을 선택하는 방법은 무엇입니까?

때로는 스프레드 시트에서 가장 높은 값이나 가장 낮은 값을 찾아서 선택하거나 최고 판매액, 최저 가격 등과 같은 선택을해야 할 수도 있습니다. 어떻게 처리합니까? 이 기사에서는 선택 항목에서 가장 높은 값과 가장 낮은 값을 찾아 선택하는 몇 가지 까다로운 팁을 제공합니다.


수식을 사용하여 선택 항목에서 가장 높은 값 또는 가장 낮은 값 찾기


범위에서 가장 큰 숫자 또는 가장 작은 숫자를 얻으려면 :

결과를 얻으려는 빈 셀에 아래 수식을 입력하십시오.

Get the largest value: =Max (B2:F10)
Get the smallest value: =Min (B2:F10)

그런 다음 엔터 버튼 범위에서 가장 큰 숫자 또는 가장 작은 숫자를 얻으려면 키를 누르십시오. 스크린 샷을 참조하십시오.


범위에서 가장 큰 3 개 또는 가장 작은 3 개의 숫자를 얻으려면 :

때때로 워크 시트에서 가장 큰 숫자 또는 가장 작은 숫자 3 개를 찾고 싶을 수 있습니다.이 섹션에서는이 문제를 해결하기위한 공식을 소개합니다. 다음과 같이하십시오.

셀에 아래 수식을 입력하십시오.

Get the largest 3 values: =LARGE(B2:F10,1)&", "&LARGE(B2:F10,2)&", "&LARGE(B2:F10,3)
Get the smallest 3 values: =SMALL(B2:F10,1)&", "&SMALL(B2:F10,2)&", "&SMALL(B2:F10,3)

  • 팁 : 가장 크거나 가장 작은 5 개의 숫자를 찾으려면 &를 사용하여 다음과 같이 LARGE 또는 SMALL 함수를 결합하면됩니다.
  • =LARGE(B2:F10,1)&", "&LARGE(B2:F10,2)&", "&LARGE(B2:F10,3)&","&LARGE(B2:F10,4) &","&LARGE(B2:F10,5)

방문 꿀팁:이 공식을 기억하기가 너무 어렵지만 자동 텍스트 특징 Excel 용 Kutools, 필요한 모든 공식을 저장하고 언제 어디서나 원하는대로 재사용 할 수 있습니다.     Excel 용 Kutools를 다운로드하려면 클릭하십시오!


조건부 서식을 사용하여 선택 항목에서 가장 높은 값 또는 가장 낮은 값을 찾아 강조 표시

일반적으로 조건부 서식 기능은 또한 셀 범위에서 가장 큰 또는 가장 작은 n 값을 찾고 선택하는 데 도움이 될 수 있습니다. 다음과 같이하십시오.

1. 딸깍 하는 소리 > 조건부 서식 > 상위 / 하위 규칙 > 상위 10 개 항목, 스크린 샷 참조 :

2. 에서 상위 10 개 항목 대화 상자에서 찾으려는 가장 큰 값의 수를 입력 한 다음 하나의 형식을 선택하면 가장 큰 n 값이 강조 표시됩니다. 스크린 샷을 참조하십시오.

  • 팁 : 가장 낮은 n 값을 찾아 강조 표시하려면 클릭하기 만하면됩니다. > 조건부 서식 > 상위 / 하위 규칙 > 하위 10 개 항목.

강력한 기능으로 선택 항목에서 가장 높은 값 또는 가장 낮은 값을 모두 선택하십시오.

XNUMXD덴탈의 Excel 용 Kutools's 최대 및 최소 값이있는 셀 선택 가장 높은 값 또는 가장 낮은 값을 찾는 데 도움이 될뿐만 아니라 선택 항목에서 모두 함께 선택합니다.

팁 :이것을 적용하려면 최대 및 최소 값이있는 셀 선택 먼저 기능을 다운로드해야합니다. Excel 용 Kutools을 클릭 한 다음 기능을 빠르고 쉽게 적용하십시오.

설치 후 Excel 용 Kutools, 다음과 같이하십시오.

1. 작업 할 범위를 선택한 다음 쿠툴 > 선택 > 최대 및 최소 값이있는 셀 선택…, 스크린 샷 참조 :

3. 에서 최대 및 최소 값이있는 셀 선택 대화 상자 :

  • (1.) 검색 할 셀 유형 (수식, 값 또는 둘 다)을 잠깐 들여다보다 상자;
  • (2.) 그런 다음 최대 가치 or 최소값 당신이 필요로;
  • (3.) 최대 또는 최소 기준 범위를 지정하고 여기에서 선택하십시오 세포.
  • (4.) 그런 다음 첫 번째 일치하는 셀을 선택하려면 첫 번째 셀만 옵션, 일치하는 모든 셀을 선택하려면 모든 세포 옵션을 선택합니다.

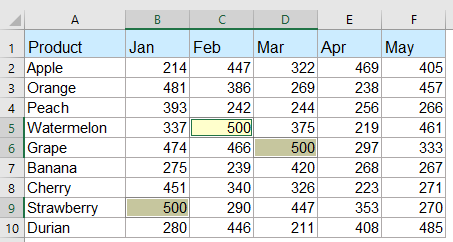
4. 그런 다음 OK, 선택 항목에서 가장 높은 값 또는 가장 낮은 값을 모두 선택합니다. 다음 스크린 샷을 참조하십시오.

가장 작은 값을 모두 선택하십시오.

가장 큰 값을 모두 선택하십시오.

Excel 용 Kutools를 지금 다운로드하고 무료로 평가하십시오!


강력한 기능으로 각 행 또는 열에서 최고 또는 최저 값 선택

각 행 또는 열에서 가장 높은 값 또는 가장 낮은 값을 찾아 선택하려면 Excel 용 Kutools 또한 당신에게 호의를 베풀 수 있습니다, 다음과 같이하십시오 :

1. 가장 큰 값 또는 가장 작은 값을 선택할 데이터 범위를 선택하십시오. 그런 다음 쿠툴 > 선택 > 최대 및 최소 값이있는 셀 선택 이 기능을 사용하려면

2. 에서 최대 및 최소 값이있는 셀 선택 대화 상자에서 필요에 따라 다음 작업을 설정합니다.

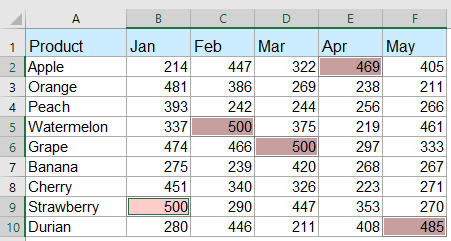
4. 그런 다음 Ok 버튼을 클릭하면 각 행 또는 열의 모든 최대 또는 최소 값이 한 번에 선택됩니다. 스크린 샷을 참조하십시오.

각 행에서 가장 큰 값

각 열의 가장 큰 값

Excel 용 Kutools를 지금 다운로드하고 무료로 평가하십시오!


셀 범위 또는 각 열과 행에서 가장 큰 값 또는 가장 작은 값을 가진 모든 셀을 선택하거나 강조 표시합니다.

Excel 용 Kutools's 최대 및 최소 값이있는 셀 선택 기능을 사용하면 필요에 따라 셀 범위, 각 행 또는 각 열에서 가장 큰 값 또는 가장 작은 값을 모두 빠르게 선택하거나 강조 표시 할 수 있습니다. 아래 데모를 참조하십시오.    Excel 용 Kutools를 다운로드하려면 클릭하십시오!


상대적으로 가장 큰 또는 가장 작은 가치 기사 :

  • Excel에서 중복없이 N 번째로 큰 값 찾기 및 가져 오기
  • Excel 워크 시트에서 Large 함수를 적용하여 가장 큰 값, 두 번째로 큰 값 또는 n 번째로 큰 값을 얻을 수 있습니다. 그러나 목록에 중복 값이있는 경우이 함수는 n 번째로 큰 값을 추출 할 때 중복 값을 건너 뛰지 않습니다. 이 경우 Excel에서 중복없이 n 번째로 큰 값을 어떻게 얻을 수 있습니까?
  • Excel에서 N 번째로 큰 / 가장 작은 고유 값 찾기
  • 일부 중복이 포함 된 숫자 목록이있는 경우이 숫자 중에서 n 번째로 크거나 가장 작은 값을 얻으려면 일반 Large 및 Small 함수가 중복을 포함한 결과를 반환합니다. Excel에서 중복을 무시하고 n 번째로 크거나 가장 작은 값을 어떻게 반환 할 수 있습니까?
  • 각 행 또는 열에서 가장 큰 / 가장 낮은 값 강조
  • 여러 열 및 행 데이터가있는 경우 각 행 또는 열에서 가장 큰 값 또는 가장 낮은 값을 어떻게 강조 표시 할 수 있습니까? 각 행이나 열에서 값을 하나씩 식별하면 지루할 것입니다. 이 경우 Excel의 조건부 서식 기능이 도움이 될 수 있습니다. 자세한 내용을 보려면 더 읽어보십시오.
  • Excel 목록에서 최대 또는 최소 3 개의 값 합계
  • SUM 함수를 사용하여 숫자 범위를 더하는 것이 일반적이지만 때로는 범위에서 가장 크거나 가장 작은 3, 10 또는 n 개의 숫자를 합산해야합니다. 복잡한 작업 일 수 있습니다. 오늘은이 문제를 해결하기위한 몇 가지 공식을 소개합니다.

최고의 사무 생산성 도구

🤖 Kutools AI 보좌관: 다음을 기반으로 데이터 분석을 혁신합니다. 지능형 실행   |  코드 생성  |  사용자 정의 수식 만들기  |  데이터 분석 및 차트 생성  |  Kutools 기능 호출...
인기 기능: 중복 항목 찾기, 강조 표시 또는 식별   |  빈 행 삭제   |  데이터 손실 없이 열이나 셀 결합   |   수식없이 반올림 ...
슈퍼 조회: 다중 기준 VLookup    다중 값 VLookup  |   여러 시트에 걸친 VLookup   |   퍼지 조회 ....
고급 드롭다운 목록: 드롭다운 목록을 빠르게 생성   |  종속 드롭다운 목록   |  다중 선택 드롭 다운 목록 ....
열 관리자: 특정 개수의 열 추가  |  열 이동  |  Toggle 숨겨진 열의 가시성 상태  |  범위 및 열 비교 ...
특색 지어진 특징: 그리드 포커스   |  디자인보기   |   큰 수식 바    통합 문서 및 시트 관리자   |  리소스 라이브러리 (자동 텍스트)   |  날짜 선택기   |  워크 시트 결합   |  셀 암호화/해독    목록으로 이메일 보내기   |  슈퍼 필터   |   특수 필터 (굵게/기울임꼴/취소선 필터링...) ...
상위 15개 도구 세트12 본문 도구 (텍스트 추가, 문자 제거,...)   |   50+ 거래차트 유형 (Gantt 차트,...)   |   40+ 실용 방식 (생일을 기준으로 나이 계산,...)   |   19 삽입 도구 (QR 코드 삽입, 경로에서 그림 삽입,...)   |   12 매출 상승 도구 (숫자를 단어로, 환율,...)   |   7 병합 및 분할 도구 (고급 결합 행, 셀 분할,...)   |   ... 그리고 더

Excel용 Kutools로 Excel 기술을 강화하고 이전과는 전혀 다른 효율성을 경험해 보세요. Excel용 Kutools는 생산성을 높이고 시간을 절약하기 위해 300개 이상의 고급 기능을 제공합니다.  가장 필요한 기능을 얻으려면 여기를 클릭하십시오...

상품 설명


Office Tab은 Office에 탭 인터페이스를 제공하여 작업을 훨씬 쉽게 만듭니다.

  • Word, Excel, PowerPoint에서 탭 편집 및 읽기 사용, Publisher, Access, Visio 및 Project.
  • 새 창이 아닌 동일한 창의 새 탭에서 여러 문서를 열고 만듭니다.
  • 생산성을 50% 높이고 매일 수백 번의 마우스 클릭을 줄입니다!
Comments (39)
Rated 5 out of 5 · 1 ratings
This comment was minimized by the moderator on the site
Hi, any idea why this formula does not work: =MAX(B5,B8,B11,B14)-MIN(B5,B8,B11,B14)

=MAX(B5:B14)-MIN(B5:B14) works but I want just the four cells, not the whole range...
This comment was minimized by the moderator on the site
Hi there,

The formula should work. Is there anything wrong with the data type?

Amanda
This comment was minimized by the moderator on the site
Hi, can u help me. i got some problem on how to retrieve which outlet got lowest growth percentage since the percentage got duplicate value

for example

PEN001 -83.33%
PEN002 -83.33%
PEN003 -92.31%
PEN004 -100.00%
PEN005 -100.00%

I'm using index match min (lowest) & small (for 2nd lowest), but the result will return PEN004 for both condition which is the lowest and 2nd lowest
This comment was minimized by the moderator on the site
Hi,

To ignore the duplicate values and only count unique values, you can use the formula below:
=INDEX(A1:A6,MATCH(SMALL(IF(ISNUMBER(B1:B6),IF(ROW(B1:B6)=MATCH(B1:B6,B1:B6,0),B1:B6)),2),B1:B6,0))

In the above formula, A1:A6 is the list of PEN00N, B1:B6 is the list of percentages, 2 means to get the 2nd lowest value.
https://www.extendoffice.com/images/stories/comments/ljy-picture/2nd_unique_lowest_value.png

Note that this formula works for unique values only, which means it will only return the first value if there are duplicates.

Amanda
This comment was minimized by the moderator on the site
Cześć,

Potrzebuje poznać sposób na rozbudowanie komendy max/min by w docelowej komórce pokazywała wartość wraz z kolorem komórki.

Przykład
mam 3 dostawców z różnymi cenami tych samych produktów (produkty pionowo, dostawcy poziomo)
Dostawcy są przykładowo w kolumnach E,F,G i każdemu przydzieliłem inny kolor, który obowiązuje również ceny danego dostawcy.
W komórkach H chciałbym by pokazała się najniższa cena wraz z kolorem danego dostawcy.

dzięki!
This comment was minimized by the moderator on the site
Hi there,

Let's say the table is as shown below, you could use Excel's Conditional formatting to get the result you want:
https://www.extendoffice.com/images/stories/comments/ljy-picture/example.png

1. Enter =MIN(E1:G1,I1) in cell H1, and then copy the formula to below cells.
https://www.extendoffice.com/images/stories/comments/ljy-picture/get-min.png
2. Selet the list H1: H5, and then on the Home tab, click Conditional Formatting > New rule.
3. In the dialog box, selet Use a formula to determine which cells to format; Enter =$H1=$E1; And then click on Format to choose the background color of cell E1.
https://www.extendoffice.com/images/stories/comments/ljy-picture/create-rule.png
4. Repeat the step 3 to create rules for other background colors: =$H1=$F1 > light blue; =$H1=$G1 > light green; ...

Now, your table should look like this:
https://www.extendoffice.com/images/stories/comments/ljy-picture/result.png

Amanda
This comment was minimized by the moderator on the site
I have a table and I need to sum the columns(which I have done) then I need to find the lowest value (which I have done) how do I display the column title of the lowest value?

Thanks
This comment was minimized by the moderator on the site
Hi, could you please show me a screenshot of your data?

Amanda
This comment was minimized by the moderator on the site
Bonjour Amanda

Ca marche !!!! 😀 🤩 👌
Merci vraiment

Puis-je vous demander de nouveau votre aide ?
Voici la formule que je recherche

A1 A2 A3 A4
Chien Colibri Renard OK
Chat Renard Chien OK
Souris Chien Lion Non
Colibri Ecureuil Marmotte Non
Eléphant Colibri Chat OK

Si en A3 on retrouve les mots des colonnes A1 et A2 alors la colonne A4 indique OK
Si en A3 on ne retrouve pas les mots des colonnes A1 et A2 alors la colonne A4 indique Non

Merci encore pour votre aide très précieuse pour une débutante en excel

Bonne journée
Rated 5 out of 5
This comment was minimized by the moderator on the site
Hi, I don't quite understand why did you asign OK to the first and second rows, since I don't see that the third value is the same as the first or second one.

Amanda
This comment was minimized by the moderator on the site
Bonjour Amanda,

Je vous ai renvoyé le fichier à l'adresse mail indiquée : à l'instant

Merci encore une fois de votre aide.

Bien cordialement
This comment was minimized by the moderator on the site
Hi there,

I tried your excel file in the French enviorment, please use =IF(A1=MAX($A$1:$A$4);1;0).
The seperator should be ";" instead of "," 😅
(If the formula does not work, use SI instead of IF)

Amanda
This comment was minimized by the moderator on the site
Bonjour Amanda

Ne pouvons joindre de fichier sur le site, j'ai répondu au mail que vous m'avez envoyé et j'y ai joins le fichier excel
Vous pourrez voir ainsi que cela me mets en erreur.

Merci encore de votre aide

Bien cordialement
This comment was minimized by the moderator on the site
Hi there,

Did you send the excel file to ?
I did not receive any messages about the issue. Could you please send that again?
Also, I think the .xlsx file is supported to upload here. If you want, you can just upload it here in a comment.

Amanda
This comment was minimized by the moderator on the site
Bonjour,
En premier lieu merci pour tout ça j'y ai trouvé plein plein de soluces.
Ma question est la suivante
J'ai une colonne avec des chiffres

26.56250
25.10400
26.29101
27.66667

Et je voudrais en parallèle une formule qui va me dire non seulement le nombre le plus élevé (ça j'ai trouvé dans vos explications) mais que cette colonne indique 1 pour le chiffre le plus élevé.
Voici un exemple

26.56250 = 0
25.10400 = 0
26.29101 = 0
27.66667 = 1

Pensez-vous que cela soit possible et si oui via quelle formule ?

Je vous remercie encore et par avance en + 😄

Bien cordialement
This comment was minimized by the moderator on the site
Hi there,

Let's say the four values are in range A1:A4, you can enter the below formula in B1:
=IF(A1=MAX($A$1:$A$4),1,0)
And then drag the fill handle down to apply the formula to below cells.
https://www.extendoffice.com/images/stories/comments/ljy-picture/return-1-if-max.png

Amanda
This comment was minimized by the moderator on the site
Bonjour Amandine
Tout d'abord merci pour cette réponse.
Malheureusement cela ne fonctionne pas <font style="vertical-align: inherit;"><font style="vertical-align: inherit;">😞</font></font>

J'ai le message d'erreur habituel
Pouvez-vous m'aider encore une fois ?

Merci
This comment was minimized by the moderator on the site
Hi there,

Can tell me what error it is? I noticed that you are using French, so please try SI instead of IF: =SI(A1=MAX($A$1:$A$4),1,0)

Amanda
This comment was minimized by the moderator on the site
Good day
I have difficulty with excel and don't know the exact names of what I want but will give it a try ?

1. I have 4 Colom's A, B, C, D, =MAX()
9, 2, 4, 1,
I want a formula that include the A,B,C,D, for instance, want the formula to include the "A" and "9" as well like A9?


2 A, B, C, D,
9, 8, 9, 2,
I also need a formula for if there is 2 (or 3 or even 4) equals highs, where I can "A9" and "C9" selected as highest ?

3 base on this information how can I create an automated report for the login user once they have selected the highest value ?

4. Maybe this is not the place to ask, but how can I create a time limit for the usage of the excel workbook that expires after 30 minutes and automatically email the report
to the login user?

5. lastly the report that the user will receive is in word format

Thank you so much
Have a wonderful day
This comment was minimized by the moderator on the site
How do I write a formula to find the smallest percentage in these 3 columns and return the value as LAG Alt or GDF or DEL?
LAG ALT -5% GDF -32% DEL 28%

In example above LAG ALT is the smallest percent/Choice I would want
This comment was minimized by the moderator on the site
Hi, the value to be compared and text string have to be in two cells for excel to compre. I have wrote a formula to get the result you want: =INDEX(A2:C2,MATCH(MIN(ABS(A3:C3)),ABS(A3:C3),0)) Please refer to the screenshot to see how it works. For more details about the formula, please click the link below. I only added ABS function (to get the absolute value) to the formula listed in the article: https://www.extendoffice.com/excel/formulas/excel-get-information-corresponding-to-minimum-value.html
There are no comments posted here yet
Load More
Please leave your comments in English
Posting as Guest
×
Rate this post:
0   Characters
Suggested Locations