Excel 피벗 테이블에서 전체 합계/소계 열의 백분율을 추가하려면 어떻게 해야 하나요?
Excel에서 대규모 데이터 세트를 다루고 피벗 테이블로 분석할 때, 도구는 자동으로 숫자 데이터를 집계하는 전체 합계 열 또는 행을 생성하는 경우가 많습니다. 그러나 성과 평가나 판매 비교와 같은 많은 실용적인 상황에서는 총합뿐만 아니라 각 항목이 전체 합계 또는 하위 그룹 소계에 대해 차지하는 비율(백분율)도 확인해야 하는 경우가 많습니다. 이러한 백분율을 값 옆에 직접 표시함으로써 주요 기여 요소를 신속하게 식별하고, 추세를 파악하며, 통찰력을 더 효과적으로 전달할 수 있습니다. 이 가이드에서는 Excel에서 데이터 분석 및 보고 작업을 간소화하기 위해 각 값을 전체 합계 또는 하위 그룹 소계의 백분율로 계산하는 추가 열을 피벗 테이블에 추가하는 방법을 단계별로 설명합니다.
➤ Excel 피벗 테이블에서 전체 합계/소계 열의 백분율 추가하기
➤ 피벗 테이블 외부에서 전체 합계의 백분율을 계산하기 위한 Excel 공식 사용하기
➤ VBA 코드를 사용하여 전체 합계 백분율을 피벗 테이블에 추가하기
Excel 피벗 테이블에서 전체 합계/소계 열의 백분율 추가하기
각 항목이 전체 합계 또는 데이터 내 하위 그룹에 기여하는 백분율을 표시하려면, 백분율 계산 열을 추가하여 Excel 피벗 테이블을 강화할 수 있습니다. 이 접근 방식은 원시 데이터를 넘어선 데이터 비교를 수행하거나 요약 통계를 제시하고자 할 때 특히 유용합니다. 다음의 확장된 단계들은 이 기능을 설정하는 방법을 설명하며, 각 단계에서 실질적인 팁과 고려 사항도 제공합니다.
1. 피벗 테이블에서 분석하고자 하는 데이터 범위를 선택하세요. 그런 다음 Excel 리본 메뉴로 이동하여 삽입 > 피벗테이블을 클릭하세요. 이렇게 하면 분석을 위한 피벗 테이블 기반이 생성됩니다. 처음부터 정확한 소스 범위를 선택하면 계산이 정확해집니다. 선택 영역이 모든 관련 데이터를 포함하고 있는지 빈 행이나 열이 없는지 다시 한 번 확인하세요.
2. 나타나는 피벗테이블 만들기 대화상자에서 피벗 테이블을 새 워크시트에 배치할지 기존 워크시트에 배치할지 지정하세요. 새로운 워크시트를 선택하면 테이블이 보기 쉬워지고 원래 데이터는 유지됩니다. 선호도를 설정한 후 확인 버튼을 클릭하여 진행합니다.

3. 피벗테이블 필드 창에서 샵 필드와 아이템 필드를 행 영역으로 드래그하세요. 그런 다음 판매 필드를 값 영역으로 드래그하세요. 두 번이렇게 하면 결과 테이블에서 원래 판매 값과 백분율 계산을 나란히 표시할 수 있습니다. 백분율 열만 표시하려면 원래 값 필드를 나중에 제거하거나 숨길 수 있습니다.

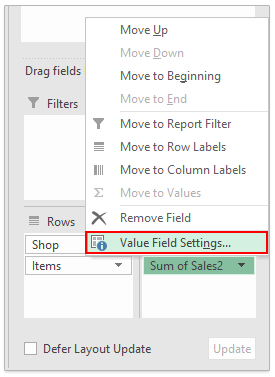
4. 아래 값 영역에서 두 번째 Sales field (this will typically show as “Sum of Sales2” by default). Select Value Field Settings from the context menu. This step opens a dialog box where you can define how the field’s data is summarized and displayed in the table.
5. Within the Value Field Settings dialog box, go to the Show Values As tab. From the Show value as drop-down menu, pick % of Grand Total to calculate each value as a proportion of the grand total. Optionally, type a clear, descriptive name for your new column in the Custom Name field, such as "Percent of Total Sales," to make interpretation easier. Confirm your changes by clicking OK.

Note: If you'd like to show the percentage that each value represents of its parent subtotal (rather than the overall grand total), select % of Parent Row Total from the Show values as drop-down menu instead. This option is especially valuable when your dataset has grouped rows—such as categories under a shop—so you can analyze contribution to category-level totals.
Upon returning to the pivot table, you'll now see an added column displaying the “Percent of Grand Total” alongside the original values. This allows immediate comparison, making it much easier to interpret which items or categories are making the largest contribution to total results.

Note: When you select % of Parent Row Total in step 5, the percentage reflects each item's contribution to its respective subtotal (e.g., each product’s share within a shop), offering a more granular perspective on your data.

💡 Tips and Considerations:
- If your original data contains filters or blanks, double-check your pivot table for accuracy after setting up the percentages.
- Formatting might display numbers as decimals by default; right-click the percentage column, choose Number Format, and select the Percentage format.
- In some versions of Excel, field names or interfaces may differ slightly—focus on the general steps if your screen doesn’t match exactly.
- If the “Show Values As” options are greyed out, ensure numerical fields are in the Values area and the PivotTable is selected.
Adding percentage columns this way is useful for dashboards, quick performance analysis, and summarizing detailed data for presentations or management reports. However, if you need further customizations, such as conditional formatting or more advanced calculations, consider using calculated fields or supplementary Excel formulas for additional flexibility.
If you are interested in alternative approaches or need to achieve customized percentage calculations outside standard PivotTable options, try supplementing your report with Excel formulas or even automating your workflow with simple VBA. These methods offer more control, especially when built-in “Show Values As” settings don’t meet special requirements.
Use an Excel Formula to Calculate Percent of Grand Total Outside the Pivot Table
In some scenarios, you may want to display the percent of grand total directly next to your pivot table, or you require more formatting options than the built-in "Show Values As" feature offers. In this case, you can use Excel formulas outside the pivot table to perform the calculation.
1. Locate the numeric values column in your pivot table (for example, suppose your sales values are in cell range D5:D10). Next, identify the cell containing the grand total (such as D11). Alternatively, you can use the GETPIVOTDATA function to reference the total more reliably.
2. In the adjacent column (for instance, cell E5), enter the following formula to calculate the percent of grand total for each item:
=D5/$D$11Or use this more robust version with GETPIVOTDATA (assuming the total value field is "Sales" and the pivot table starts in cell D4):
=D5/GETPIVOTDATA("Sales", $D$4)These formulas divide each value by the grand total, ensuring a relative percentage is calculated for each row. Adjust the field name and cell references to match your actual pivot table layout.
3. Copy the formula down alongside the entire values range. For best results, format the new column as Percentage by selecting the range, right-clicking, choosing Format Cells, and picking Percentage.
Practical tip: This method offers flexibility for further customization (such as additional conditions or color-coding with conditional formatting). However, as your pivot table updates, double-check that formula references remain accurate—especially if items or rows change dynamically. Using GETPIVOTDATA helps prevent broken references in such cases.
Use VBA Code to Add Percentage of Grand Total to Pivot Table
For users who need to automate the process of adding a percent of grand total measure—especially when creating multiple pivot tables for reporting—VBA provides a customizable approach. This practical solution is ideal for recurring tasks or templates. Please follow these steps:
1. Click Developer Tools > Visual Basic to open the Microsoft Visual Basic for Applications window. In the VBA window, click Insert > Module, then copy and paste the following code into the module:
Sub AddPercentOfGrandTotal()
    Dim pt As PivotTable
    Dim pf As PivotField
    Dim pfNew As PivotField
    Dim xTitleId As String
    xTitleId = "KutoolsforExcel"

    If ActiveSheet.PivotTables.Count = 0 Then
        MsgBox "No PivotTable found on this sheet.", vbExclamation, xTitleId
        Exit Sub
    End If

    Set pt = ActiveSheet.PivotTables(1)

    If pt.DataFields.Count = 0 Then
        MsgBox "No data field found in the PivotTable.", vbExclamation, xTitleId
        Exit Sub
    End If

    Set pf = pt.DataFields(1)

    ' Check if the field already exists
    Dim fldName As String
    fldName = "Percent of Grand Total"
    On Error Resume Next
    Set pfNew = pt.PivotFields(fldName)
    On Error GoTo 0
    If Not pfNew Is Nothing Then
        MsgBox "Field '" & fldName & "' already exists.", vbInformation, xTitleId
        Exit Sub
    End If

    ' Add new field and apply percentage calculation
    Set pfNew = pt.AddDataField(pt.PivotFields(pf.SourceName), fldName, xlSum)
    With pfNew
        .Calculation = xlPercentOfTotal
        .NumberFormat = "0.00%"
    End With
End Sub2. After inserting the code, click the ![]() “Run” button or press F5 to execute. The macro will automatically add a new field showing the percent of grand total in your existing pivot table on the current sheet.
“Run” button or press F5 to execute. The macro will automatically add a new field showing the percent of grand total in your existing pivot table on the current sheet.
Notes and Troubleshooting: This code assumes your PivotTable already contains at least one data field. If you want to target a specific PivotTable by name, you can replace ActiveSheet.PivotTables(1) with something like ActiveSheet.PivotTables("PivotTable1"). Always save your workbook before running new macros and ensure macros are enabled (check Trust Center settings if the code does not run).
Related articles:
최고의 오피스 생산성 도구
| 🤖 | Kutools AI 도우미: 데이터 분석에 혁신을 가져옵니다. 방법: 지능형 실행 | 코드 생성 | 사용자 정의 수식 생성 | 데이터 분석 및 차트 생성 | Kutools Functions 호출… |
| 인기 기능: 중복 찾기, 강조 또는 중복 표시 | 빈 행 삭제 | 데이터 손실 없이 열 또는 셀 병합 | 반올림(수식 없이) ... | |
| 슈퍼 LOOKUP: 다중 조건 VLOOKUP | 다중 값 VLOOKUP | 다중 시트 조회 | 퍼지 매치 .... | |
| 고급 드롭다운 목록: 드롭다운 목록 빠르게 생성 | 종속 드롭다운 목록 | 다중 선택 드롭다운 목록 .... | |
| 열 관리자: 지정한 수의 열 추가 | 열 이동 | 숨겨진 열의 표시 상태 전환 | 범위 및 열 비교 ... | |
| 추천 기능: 그리드 포커스 | 디자인 보기 | 향상된 수식 표시줄 | 통합 문서 & 시트 관리자 | 자동 텍스트 라이브러리 | 날짜 선택기 | 데이터 병합 | 셀 암호화/해독 | 목록으로 이메일 보내기 | 슈퍼 필터 | 특수 필터(굵게/이탤릭/취소선 필터 등) ... | |
| 15대 주요 도구 세트: 12 가지 텍스트 도구(텍스트 추가, 특정 문자 삭제, ...) | 50+ 종류의 차트(간트 차트, ...) | 40+ 실용적 수식(생일을 기반으로 나이 계산, ...) | 19 가지 삽입 도구(QR 코드 삽입, 경로에서 그림 삽입, ...) | 12 가지 변환 도구(단어로 변환하기, 통화 변환, ...) | 7 가지 병합 & 분할 도구(고급 행 병합, 셀 분할, ...) | ... 등 다양 |
Kutools for Excel과 함께 엑셀 능력을 한 단계 끌어 올리고, 이전에 없던 효율성을 경험하세요. Kutools for Excel은300개 이상의 고급 기능으로 생산성을 높이고 저장 시간을 단축합니다. 가장 필요한 기능을 바로 확인하려면 여기를 클릭하세요...
Office Tab은 Office에 탭 인터페이스를 제공하여 작업을 더욱 간편하게 만듭니다
- Word, Excel, PowerPoint에서 탭 편집 및 읽기를 활성화합니다.
- 새 창 대신 같은 창의 새로운 탭에서 여러 파일을 열고 생성할 수 있습니다.
- 생산성이50% 증가하며, 매일 수백 번의 마우스 클릭을 줄여줍니다!
모든 Kutools 추가 기능. 한 번에 설치
Kutools for Office 제품군은 Excel, Word, Outlook, PowerPoint용 추가 기능과 Office Tab Pro를 한 번에 제공하여 Office 앱을 활용하는 팀에 최적입니다.
- 올인원 제품군 — Excel, Word, Outlook, PowerPoint 추가 기능 + Office Tab Pro
- 설치 한 번, 라이선스 한 번 — 몇 분 만에 손쉽게 설정(MSI 지원)
- 함께 사용할 때 더욱 효율적 — Office 앱 간 생산성 향상
- 30일 모든 기능 사용 가능 — 회원가입/카드 불필요
- 최고의 가성비 — 개별 추가 기능 구매 대비 절약